Revenue Leakage in Financial Services & Fintech
What is revenue leakage, and how can financial institutions address it?
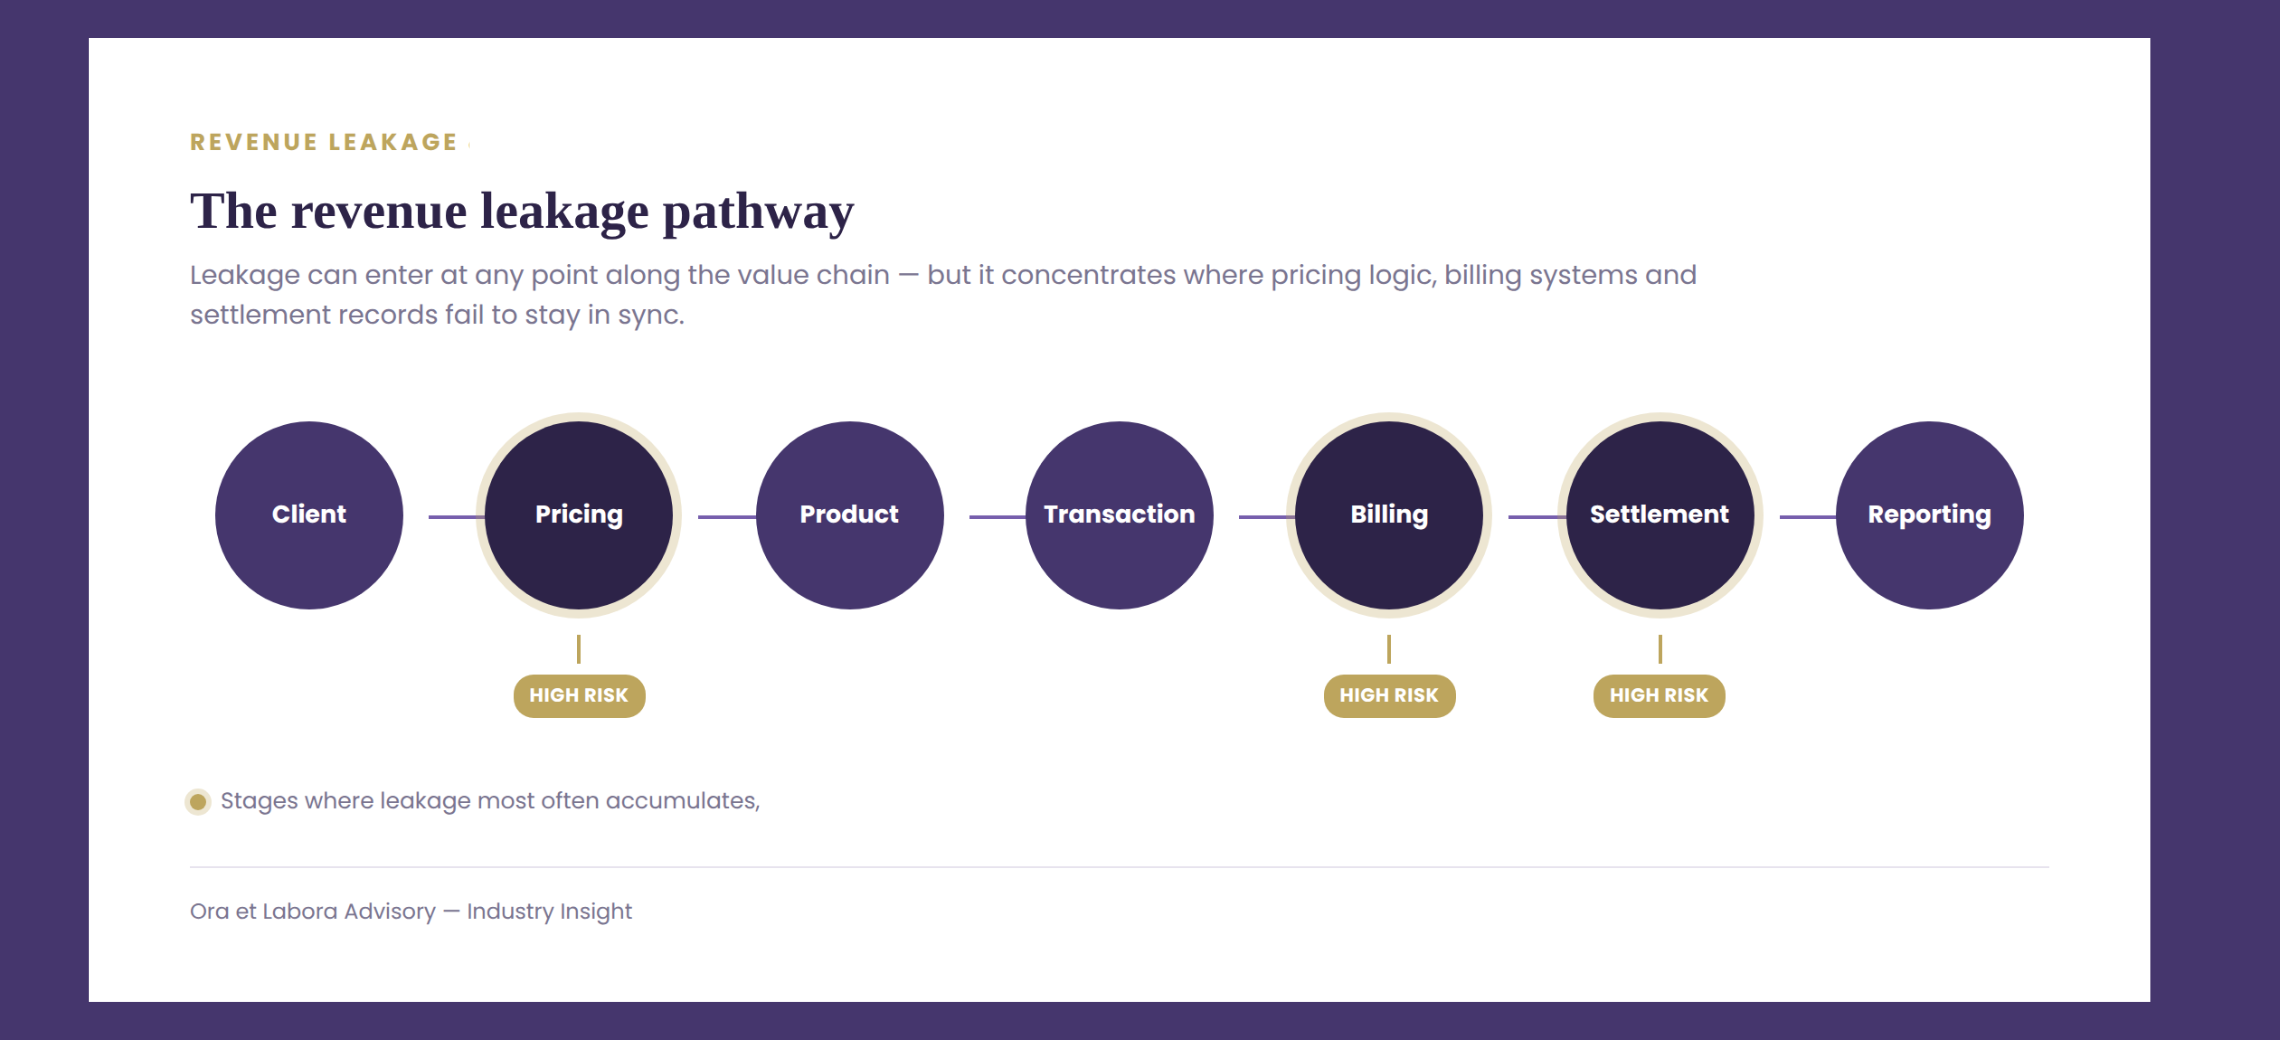
It is the inadvertent loss of revenue that a firm has earned but failed to capture or collect. The leakage can occur throughout the entire process flow:
Client → Pricing → Product → Transaction → Billing → Settlement → Reporting
The issue typically arises from inefficiencies, errors, or fraud across pricing, billing, compliance, settlement, contract management, and data flows. In other words, the value has been contractually earned or operationally delivered, but the associated revenue is not fully billed, recognised, or collected. Revenue leakage is therefore distinct from strategic discounting, ordinary bad debt, failed sales opportunities, or customer churn. It is fundamentally a realisation gap.
Traditional banking continues to operate through legacy architectures, fragmented product silos, and manual workarounds, while fintech operates at higher transaction speed, with more complex usage-based, API-based, or cross-platform billing logic. Across both worlds, revenue leakage is ultimately a coordination failure across pricing, operations, finance, technology, and controls. Your CRM may know what was sold, your operations platform may know what was delivered, and your billing engine may know what was charged. However, if those records are not aligned, revenue integrity deteriorates.
“Most revenue leakage is structural. Organisations assume that once a system is implemented, it will function seamlessly on its own, but most run on fragmented infrastructure that was never built to talk to each other, and that’s a governance issue.
Isabelle Mustapic
Founder, Ora et Labora Advisory
This matters because it is rarely visible as a single catastrophic event. In most institutions, leakage accumulates through small operational breaks: outdated fee schedules, pricing rules that do not propagate across systems, delayed invoicing, poor reconciliation, data mismatches, partner overpayments, chargebacks, tax misclassification, and compliance failures. These small drips can compound materially over time. Industry studies suggest that firms can lose roughly 3–7% of gross revenue to leakage, with associated EBITDA impact often estimated at 1–5%, although the scale varies materially by sector and by the maturity of the control environment. The current financial landscape makes the issue more acute.
Revenue leakage across the sectors is not universal. What the stated numbers reflect is the overall estimate based on some studies and consultancy findings, which identified an average 6-8% revenue leakage across banks, 3-4% leakage hidden in wealth management and usage-based fintechs may experience leakage around 9%, with broader subscription/fintech contexts often cited at 4–10%.
This means the most defensible statement is not that all financial institutions lose the same percentage, but that leakage is institution-specific, sector-sensitive, and highly dependent on control maturity.
Example: if a wealth or asset management business manages USD 50 billion in assets and earns an average blended management fee of 50 basis points, this would correspond to approximately USD 250 million in annualised management fee revenue, assuming stable AUM and no significant fee adjustments.
If 3% of that revenue is lost due to pricing, billing, or operational inefficiencies, this would imply roughly USD 7.5 million of unrealised annual revenue. This is an illustrative example rather than a market benchmark, as actual leakage varies significantly depending on pricing discipline, system integration, and control frameworks. However, it is worth noting the potential negative financial impact of revenue leakage. Money which could be deployed towards strategic initiatives and innovation, amongst others.
Industry-specific leakage drivers
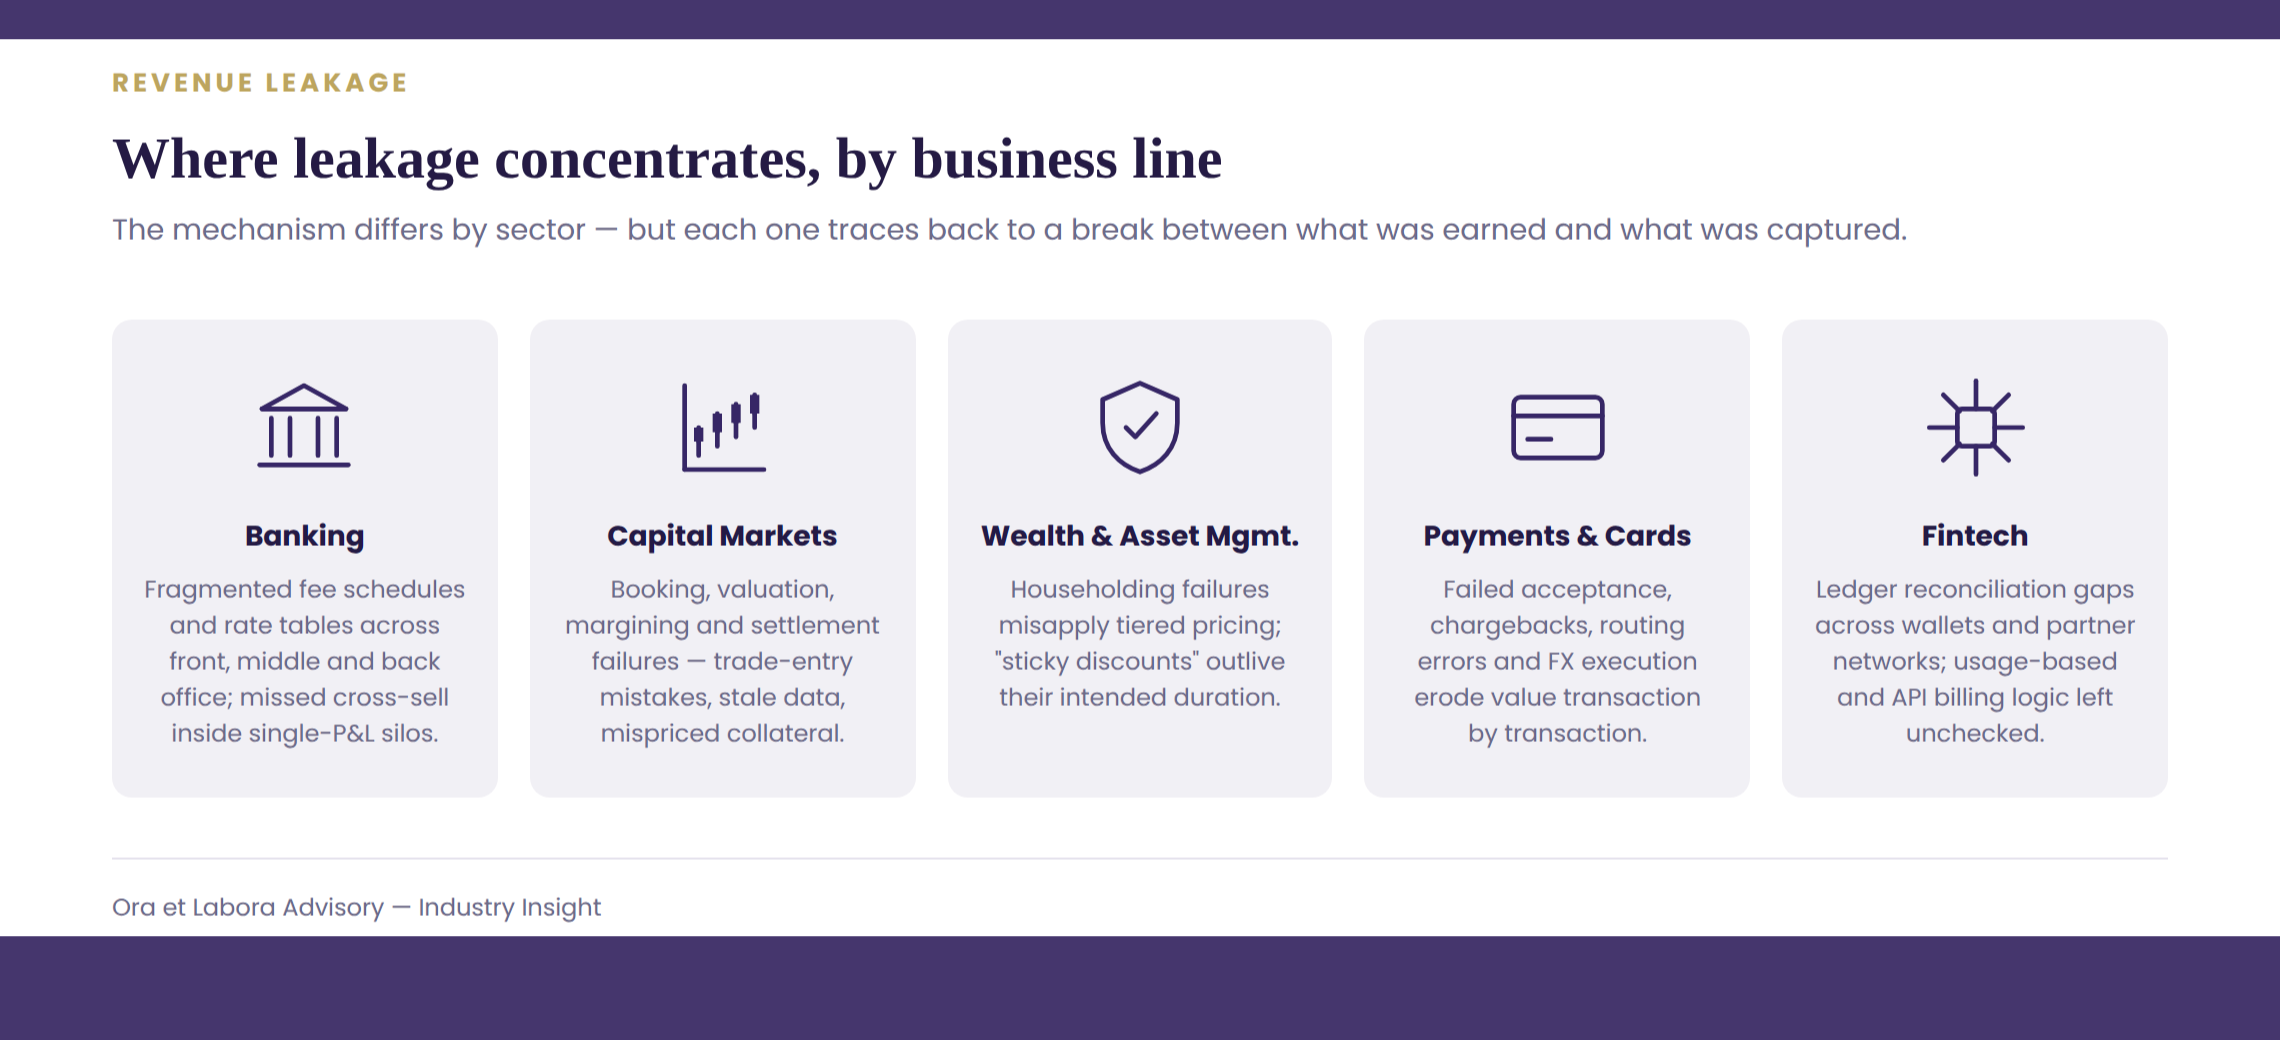
1. Banking
In banking, leakage is driven not only by pricing and billing lapses, but by a combination of weak pricing discipline, fragmented fee capture, manual operating processes, poor data integration, and control gaps across front, middle, and back office.
Legacy banks are particularly exposed when fee schedules, rate tables, or exception pricing are embedded across multiple systems and not consistently updated. Common examples include outdated maintenance or transaction fees, misposted interest, misapplied discounts, supplier and scheme overpayments, and weak governance of billing rules.
One cited case notes that a global bank overhauled its billing and core systems, retrieving 6–8% of total revenue leakage, illustrating how material, relatively mundane pricing and process fixes can be. Banking leakage is especially acute in transaction-heavy and operationally complex products such as deposits and cards, syndicated loans, trade finance, securities and prime brokerage.
A further banking problem is missed cross-sell revenue. In practice, many organisations present themselves as integrated “one-stop shops,” while internally operating as disconnected P&Ls. That weakens full-wallet capture and prevents revenue opportunities from materialising. The existence of missed cross-sell revenue in banking, though it is not precisely quantified, is a compounding series of micro-inefficiencies, which can have a substantial impact on unrealised revenue.
2. Capital Markets
In capital markets, leakage is more likely to appear through booking, valuation, margining, collateral, and settlement failures than through retail-style invoice mistakes. Common examples include trade-entry mistakes, failed or mismatched trades, stale market-data inputs, mis-valued derivatives, incorrect collateral or margin treatment, and fee-accrual problems in securities lending and prime brokerage.
3. Wealth and Asset Management
In wealth management, leakage is often structural rather than dramatic. A major source is the so-called “householding failure” i.e., the inability of the billing architecture to correctly aggregate accounts across personal, trust, or corporate structures in order to apply the correct pricing tier. If householding logic is weak, firms can misapply tiered pricing, creating either remediation costs from over-billing or direct revenue loss from under-billing or missed repricing.
Another important driver is the persistence of sticky discounts: temporary fee concessions or promotional rates that continue beyond their intended duration because they are not linked to automated expiry triggers in the billing cycle. A cited Deloitte case in the source pack found 3–4% leakage in a large wealth-management operation through contract and invoice mismatches, and an NLP solution identified the leaks within 10 weeks.
4. Payments and Card Processing
In payments, leakage occurs through failed or declined transactions, chargebacks, fraud, misapplication of interchange, routing errors, and poor FX execution in cross-border payments. A central performance measure is the acceptance rate, which is the percentage of attempted payments that convert to paid transactions. The source pack uses Stripe’s example that if acceptance is 80%, then 20% of attempted orders are not paid; this should be treated as an illustrative scenario, not as a universal industry benchmark.
Chargebacks are another major source of loss. “Friendly fraud” (i.e., when the customer makes a legitimate purchase but later claims to his bank to never made it, in order to get a refund) was the leading cause of disputed accounts for approximately 75% of chargebacks. Payment orchestration errors, poor corridor routing, and incorrect interchange treatment can further erode revenue. A U.S. tolling-agency study found approximately USD 2.24 billion in uncollected fees due to payment friction, showing that the actual payment experience itself can serve as a leakage channel.
5. Fintech
Digital-first firms face both traditional and distinctly modern leakage modes. Neobanks and electronic-money institutions can experience reconciliation gaps across customer wallets, partner networks, clearing accounts, and internal ledgers. Where those ledgers do not sync transaction-for-transaction, firms can lose float, misstate balances, or fail to book fees correctly. PSPs operating globally face FX leakage if client deposits are not hedged or time-stamped correctly. The source pack also notes crypto-specific leakage examples such as delayed crediting of on-chain transfers, stale oracle prices, and mismatched swap rates.
Studies show that subscription/fintech leakage are in the 4–10% range. The defensible conclusion is therefore that fintech, especially usage-based and API-based models, appears to suffer the highest relative leakage in the source pack, but exact percentages still vary materially by model and control quality.
The operational and profit burden of compliance
Compliance, KYC, and AML should not be treated as a separate issue from revenue integrity. They affect realised revenue through both direct and indirect mechanisms. How much they contribute to revenue leakage is harder to quantify, but their effect cannot be underestimated:
1) Rule-based monitoring systems can generate very high false-positive volumes. False-positive rates can exceed 90% in some rule-based environments, creating a substantial burden of manual review.
2) Inefficient KYC processes can delay legitimate client onboarding, pushing back revenue realisation and, in some cases, leading to customer abandonment. Research suggests that high-friction onboarding can produce abandonment rates of up to 48% among otherwise genuine customers.
3) Major AML failures can result in direct capital and earnings outflows through fines. The most recent examples include TD Bank’s USD 3 billion payment to the US regulators in 2024 and Westpac’s USD 920 million penalty. Although, these should be described as direct regulatory costs rather than hidden leakage. However, they occurred due to major governance flaws.
The right analytical conclusion is this: compliance failures do not only create operating costs. They can delay onboarding, distort collections, increase manual intervention, and in severe cases, lead to direct financial penalties. In that sense, weak compliance architecture can materially weaken revenue integrity.
Outdated infrastructures and “spreadsheet issues”
At the core of most revenue leakage is the breakdown in data integrity or system integration. Scattered systems which need to be ‘patched together’ through the marvel of manual spreadsheets. The easiest way to lose revenue.
Despite the availability of sophisticated Enterprise Resource Planning (ERP) and billing systems, many organisations continue to rely on manual spreadsheets to manage complex contract terms, such as tiered pricing and pricing escalations. Manual work and discrepancies in revenue numbers reported across systems are usually the places where leakage occurs. Revenue leakage ‘thrives’ in gaps between systems.
If there is no triple match between the contract and the delivered service, the probability of revenue leakage increases significantly. When invoices are not generated the moment the sale occurs, add-on services and pro-rated amounts are frequently omitted.
Forecasts become unreliable as finance and operations teams spend disproportionate time manually reconciling gaps, rather than focusing on strategic analysis.
Last but not least, disconnected systems make it hard to enforce contractual “price indexing” or “escalation clauses,” which require prices to increase annually based on inflation or fixed percentages. If these escalations are written into a PDF contract but are rarely implemented in the billing system, the firm loses out on potentially very significant margin growth every year.
Economic and strategic implications
Revenue leakage is operational, but it is also strategic.
Where services have already been delivered and incremental costs are low, revenue leakage can have a disproportionately high impact on EBITDA. In such cases, lost revenue often translates into a high incremental reduction in EBITDA, sometimes approaching a one-for-one effect.
For illustration: a business operating at a 10% EBITDA margin that experiences a 2% revenue leak could see EBITDA reduced by approximately 20%, assuming the lost revenue carries minimal incremental cost. This is a simplified illustration; actual impact depends on the contribution margin of the affected revenue.
Leakage also affects:
forecasting reliability
liquidity planning
capital allocation
management credibility with boards and investors.
Strategic mitigation and governance
There is no universal ‘magic wand’ which could possibly resolve this challenge in an industry of this complexity. Most traditional financial services firms still rely heavily on manual reconciliation and billing processes. The issue is both structural and technical. Structural, because an overhaul of a complex web of systems is both very risky and expensive. Given the data sensitivity and internal procedures, the question is always, which system to bring in? Which AI tool could drastically alleviate the problem, if not eliminate it altogether?
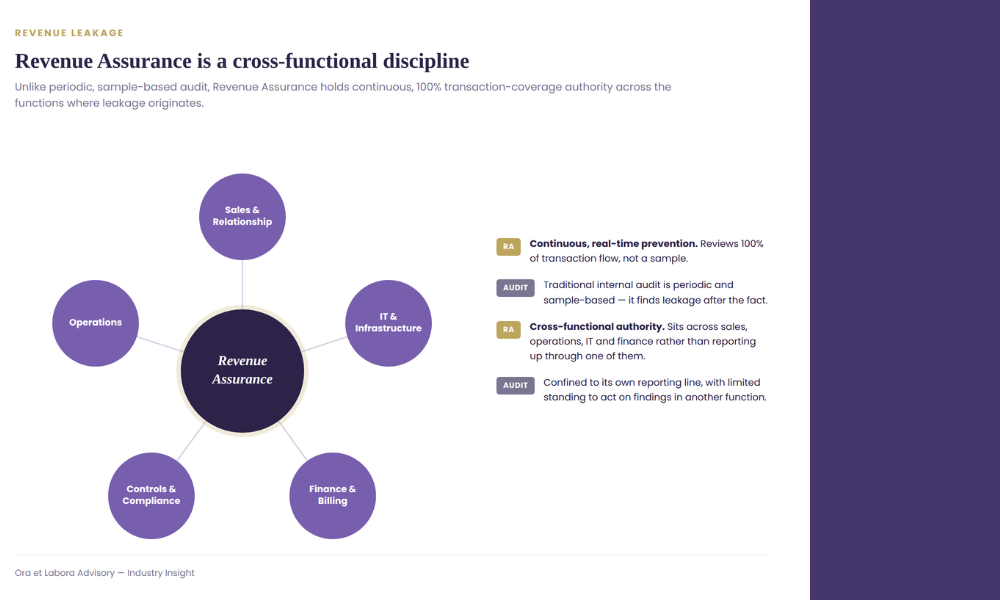
Continued pressure on margins is forcing financial institutions to establish dedicated Revenue Assurance teams. These differ from the traditional internal audit teams, which are often reactive and sample-based. The Revenue Assurance (RA) is accountable for real-time prevention and 100% transaction coverage. They have cross-functional authority, bridging the gap between sales, IT/infrastructure and finance.
This is an important distinction: Revenue Assurance is not just an internal audit renamed. Audit is often periodic and sample-based. Revenue assurance is an operating discipline focused on continuously identifying and reducing leakage.
The role of AI
AI is not ‘the miracle-performing tool’, but a major enabler of revenue assurance. The strongest use cases include:
anomaly detection on billing, usage, payment and contract data
NLP to extract billing terms and pricing clauses from unstructured contracts
reconciliation automation
prioritised alerting and triage
human-in-the-loop review
continuous learning from confirmed cases.
AI materially improves detection speed, control coverage, and prioritisation, especially where manual reconciliation is mathematically infeasible at scale. It strengthens revenue assurance, but still largely depends on data quality, workflow design, human oversight, and governance.
Final thought
Revenue leakage is not simply a billing problem. It is a control problem, a data problem, a pricing problem, and increasingly a governance problem.
The strongest lesson across firms is that leakage is rarely caused by one dramatic failure. It is usually embedded in day-to-day operating design: outdated fee logic, missed cross-sell, weak householding, failed payments, manual reconciliation, disconnected systems, soft compliance friction, and the inability to translate contractual terms into accurate billing and collection.
What matters in practice is not whether a firm can identify leakage once a year during an audit. It is whether it builds a culture of revenue integrity: shared accountability across sales, operations, IT, finance, and control functions, supported by better data discipline, stronger governance, and where appropriate, AI-enabled revenue assurance.
References:
Boston Consulting Group. (2014). Attaining execution excellence in wholesale transaction banking pricing. https://www.bcg.com
Zafin. (n.d.). Digitize and scale pricing and billing for corporate banking customers. https://zafin.com
McKinsey & Company. (n.d.). Modernizing corporate loan operations. https://www.mckinsey.com
Stripe. (n.d.). Payment acceptance and optimisation insights. https://stripe.com
PYMNTS. (2025). Manual billing costs banks millions annually. https://www.pymnts.com
Xfactrs. (n.d.). Revenue leakage: Financial and operational risks subscription companies face. https://xfactrs.com
Deloitte. (n.d.). Stopping revenue leaks with natural language processing. https://www.deloitte.com
Bobsguide. (n.d.). Fintech growth needs more than customers—it needs clean revenue. https://www.bobsguide.com
Suntec. (n.d.). Global bank revamps revenue management, reduces 6–8% revenue leakage. https://www.suntecgroup.com
Deloitte. (n.d.). Stopping revenue leaks in wealth management using NLP. https://www.deloitte.com
Some references are based on case studies, industry reports, and illustrative examples rather than peer-reviewed academic sources, reflecting the limited public disclosure of revenue leakage data across financial institutions.